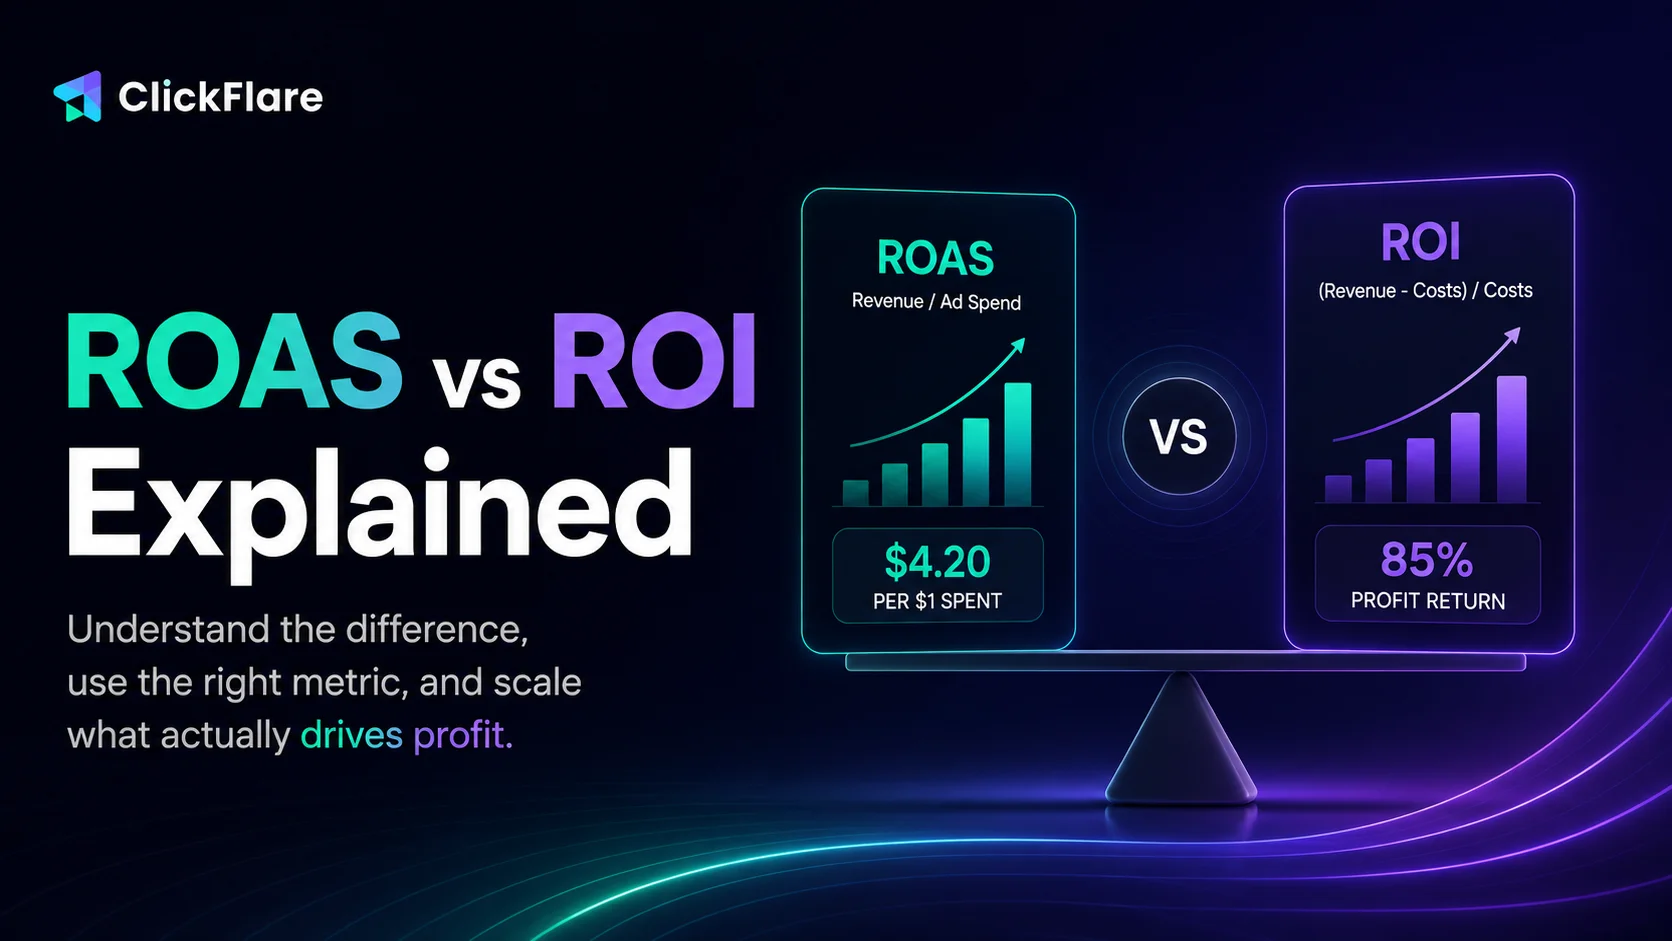
ROAS vs ROI Explained: Stop Confusing These 2 Metrics
If you've ever looked at a campaign with a glowing 5x ROAS and still ended the month wondering where the profit went, you've bumped into the gap between ROAS vs ROI. They sound like two versions of the same idea, but they answer completely different questions. One tells you if your ads are efficient. The other tells you if your business is actually making money.
In this guide, we'll break down what each metric measures, how to calculate them, when to lean on one over the other, and how to track both automatically instead of piecing them together in a spreadsheet.
[lwptoc]
Quick summary
- ROAS = Revenue ÷ Ad Spend. It measures how efficiently a specific campaign turns ad dollars into revenue.
- ROI = Net Profit ÷ Total Cost × 100. It measures whether the campaign (or the business) is actually profitable after every cost.
- A high ROAS can still mean a low or negative ROI once margin, fulfillment, and overhead are factored in.
- Use ROAS for fast, day-to-day optimization. Use ROI to decide whether a channel or campaign is worth the investment.
- ClickFlare calculates both automatically, and you can customize which one shows up front and center in your reports.
What Is ROAS?
Return on ad spend (ROAS) measures how much revenue a campaign generates for every dollar spent on advertising. It's the metric ad platforms like Meta and Google surface natively, and it's usually the first number media buyers check when deciding whether to scale, pause, or kill a campaign.
ROAS formula:
ROAS = Revenue ÷ Cost
Say a campaign spends $2,000 and generates $8,000 in revenue. That's a ROAS of 4, or 4:1, meaning every $1 spent returned $4 in revenue. Some platforms express it as a percentage instead (400%), but the math is the same either way.
ROAS is fast, native to every ad platform, and great for comparing campaigns, ad sets, or creatives against each other. What it can't tell you is whether that revenue actually turned into profit once you subtract everything else it cost you to deliver it.
What Is ROI?
Return on investment (ROI) measures the overall profitability of a campaign, expressed as a percentage of what you spent. Instead of stopping at ad cost, ROI factors in the full picture: product cost, fulfillment, software, payroll, and any other expense tied to the investment.
ROI formula:
ROI = (Net Profit ÷ Total Cost) × 100
Using the same campaign as above: $8,000 in revenue, $2,000 in ad spend. But this time, add $4,000 in product and fulfillment costs. Net profit is $8,000 − $6,000 = $2,000. ROI = ($2,000 ÷ $6,000) × 100 = 33%. Every dollar invested returned $1.33, a solid result, but a much less dramatic story than the 4x ROAS suggested on its own.
An ROI of 0% means the campaign broke even. Anything above that is genuine profit; anything below it means the campaign is losing money overall, even if the ad account looks healthy.
ROAS vs ROI: The Key Differences
Both metrics compare a return to a cost, but they're measuring at completely different altitudes. Here's how they stack up side by side:
| Aspect |
ROAS |
ROI |
| What it measures |
Revenue generated per ad dollar |
Overall profitability after all costs |
| Formula |
Revenue ÷ Ad Spend |
(Net Profit ÷ Total Cost) × 100 |
| Scope |
Ad spend only |
All costs: ad spend, product, fulfillment, overhead |
| Best for |
Daily campaign optimization, creative testing |
Budget decisions, judging true profitability |
| Native to ad platforms |
Yes (Meta, Google, TikTok) |
No, usually calculated separately |
| Break-even point |
1x (100%) |
0% |
The gap between the two is exactly where campaigns quietly bleed money while the ad dashboard looks fine. A 4x ROAS feels like a win, but if your margin is thin or your overhead is high, the real ROI can be flat or negative. Neither metric is "better," they're just answering different questions, and that's why tracking both together matters more than picking a favorite.
When to Use ROAS vs ROI
Which metric to lean on depends on the decision you're actually trying to make:
- Use ROAS when you're optimizing live campaigns, comparing creatives, or deciding which ad set to scale today. It's immediate and platform-native, which makes it the right tool for fast, tactical calls.
- Use ROI when you're deciding whether a channel, campaign, or product line is actually worth the investment. It's the number that answers the question your finance team asks: did this make money after everything?
- Use both when you're reporting to stakeholders or setting scaling rules. A campaign with strong ROAS but weak ROI usually signals a margin problem, not a targeting problem, and that distinction changes what you do next.
How ClickFlare Tracks ROAS and ROI Automatically
Calculating ROAS is straightforward once you have revenue and ad spend in the same place. ROI is where things get harder manually, since it depends on pulling in costs that live outside your ad platforms entirely: product cost, payroll, tools, fulfillment.
ClickFlare handles this by syncing cost and revenue data from your ad platforms, affiliate networks, and integrations into one dashboard, so both metrics update automatically instead of requiring a spreadsheet reconciliation at the end of the month. Every campaign report shows revenue, cost, profit, ROI, and ROAS side by side, broken down by campaign, ad, source, or any other dimension you filter on.
You're not stuck with ClickFlare's default column layout, either. You can customize exactly which metrics appear in your main campaign report, reorder them, and save the layout as a preset so it's ready every time you log in. Here's how:
- Go to your Campaigns view.
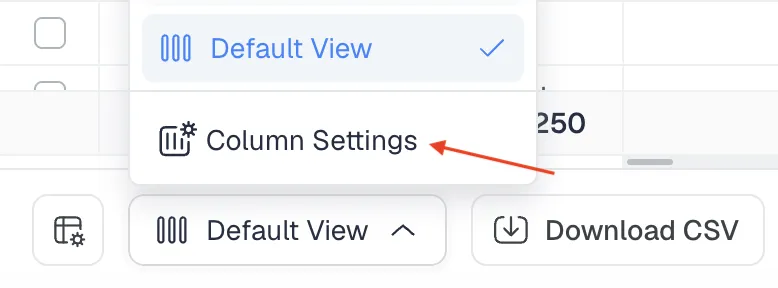
- In the bottom left of the screen, click Column Settings (next to Default View).
- In the Metrics tab, check the boxes for ROI and ROAS (along with any other metrics you want visible, like Cost, Revenue, or Profit).
- On the right side, drag and drop to set the exact column order you want them to appear in on the report.
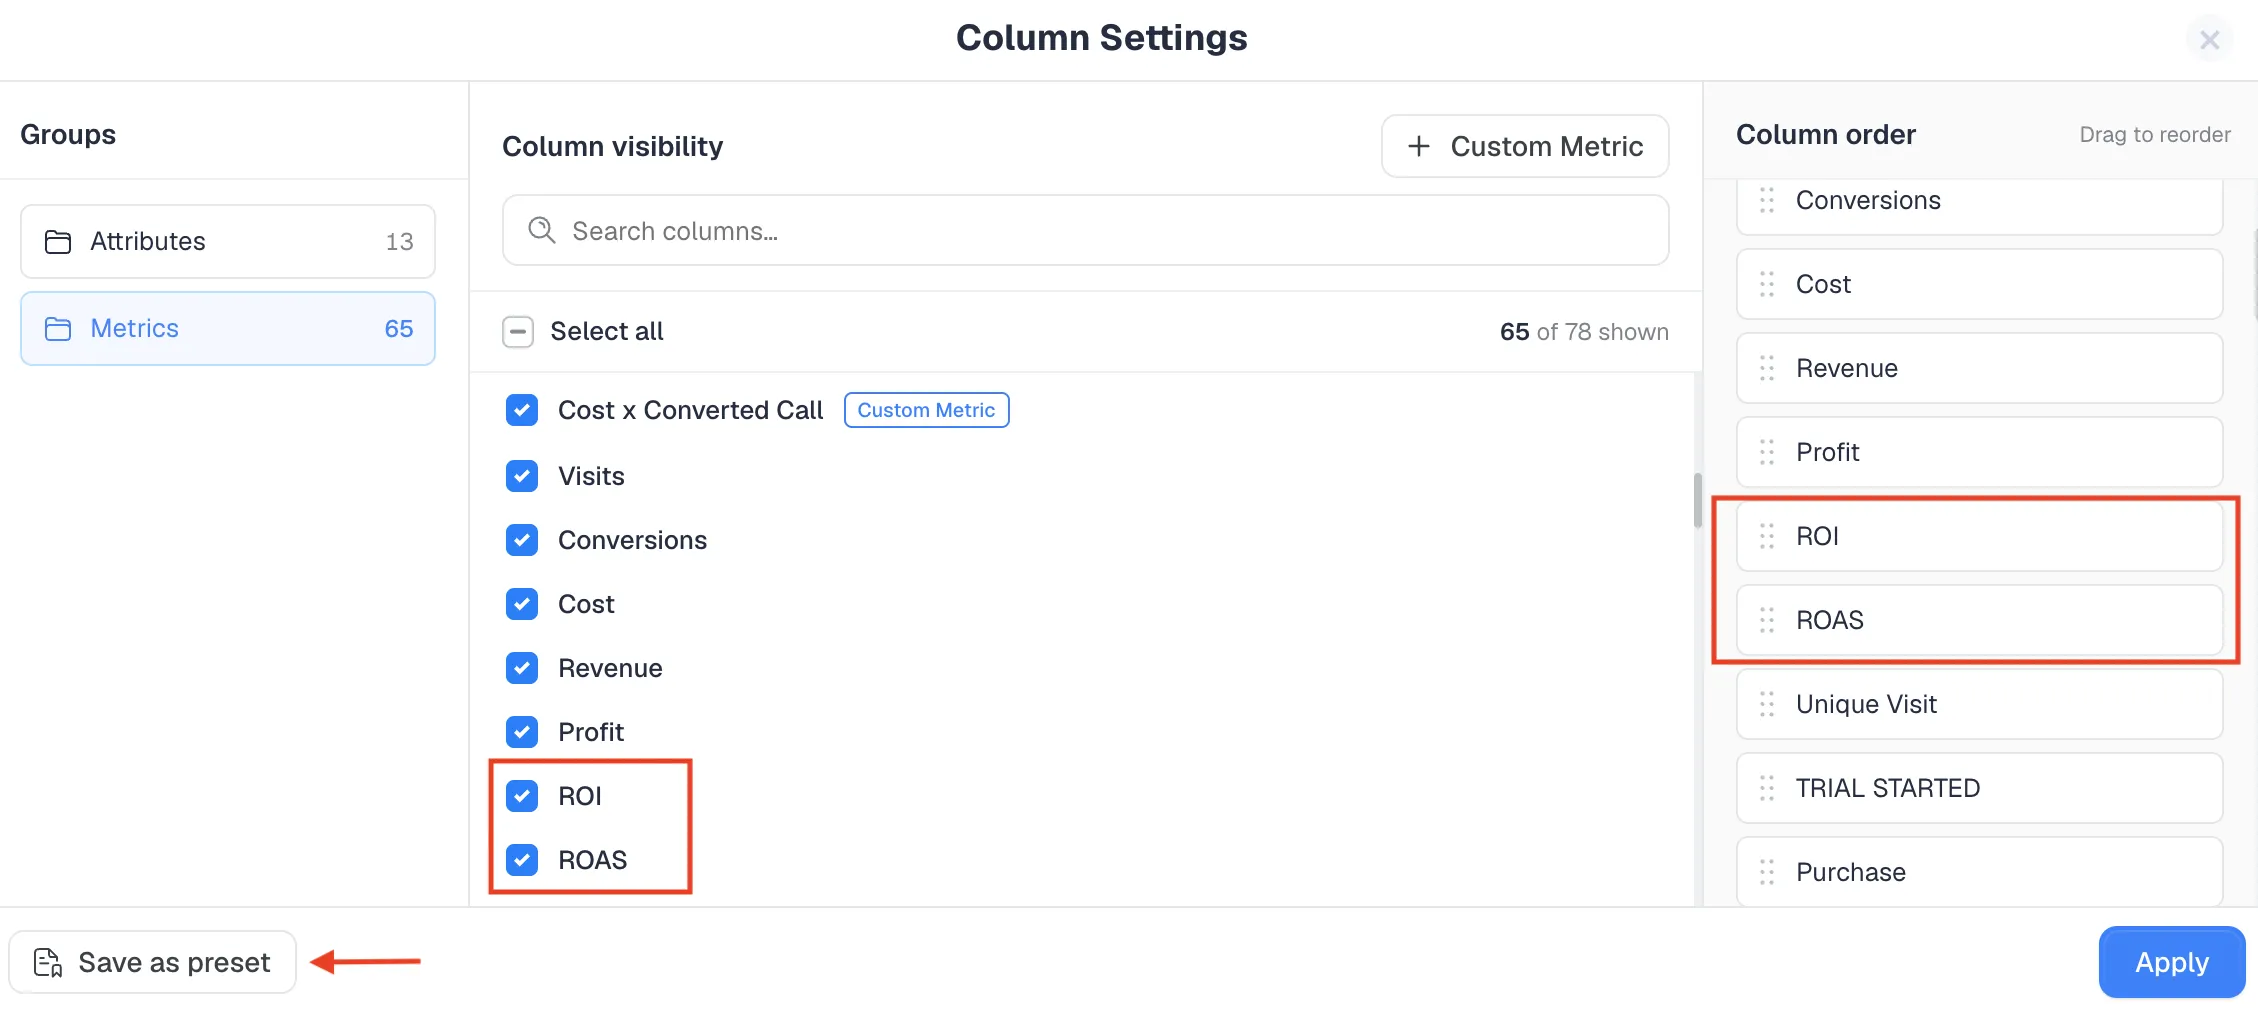
- Click Apply to update the report.
- If this is a layout you'll want to reuse, click Save as preset so you can switch back to it in one click on any future report.
A nice extra: you can also apply conditional formatting to ROI, so it highlights in green when a campaign is profitable and red when it's running at a loss, making it much faster to scan a large report and spot problems at a glance.
If you're setting up cost tracking for the first time, our guide on ad spend tracking walks through connecting your ad platforms so revenue and cost sync automatically. And if you want your ROAS and CPA numbers reacting to budget shifts in near real time instead of lagging behind, see how real-time cost tracking closes that gap.
Common Mistakes When Comparing ROAS vs ROI
- Treating ROAS as a profitability metric. ROAS only looks at revenue against ad spend. A "good" ROAS can still coexist with a business that's losing money once other costs are included.
- Ignoring margin. A rough rule of thumb: your break-even ROAS is roughly the inverse of your gross margin. At a 25% margin, you generally need about 4x ROAS just to break even before other costs.
- Only checking ROI monthly. Since ROI depends on slower-moving data like product cost and overhead, some teams check it too rarely to catch a problem early. Reviewing it weekly alongside ROAS keeps both numbers actionable.
- Manually reconciling spend and revenue. If cost data is coming from five different ad accounts and revenue from a separate system, delays and mismatches are inevitable. Centralizing that data is what makes both metrics trustworthy in the first place.
Final Thoughts on ROAS vs ROI
So, ROAS vs ROI: which one should you trust? Both, just for different jobs. ROAS tells you if your ads are working. ROI tells you if your business is. Checking only one gives you half the picture, and it's usually the flattering half. The moment you start tracking both side by side, in the same dashboard, is the moment your reporting stops lying to you by omission.
Frequently Asked Questions
Is a good ROAS the same as a good ROI?
No. A high ROAS only reflects revenue against ad spend. Once you subtract product costs, fulfillment, and overhead, the same campaign can still show a low or negative ROI.
What's a "good" ROAS?
It depends entirely on your margin. A break-even ROAS is roughly the inverse of your gross margin, so a healthy target varies by business rather than being a fixed number like 4x.
What's a good ROI for a marketing campaign?
Anything above 0% means the campaign is profitable. What counts as "good" beyond that depends on your industry, margins, and what other investments you're comparing it against.
Can I track ROAS and ROI in the same dashboard?
Yes. ClickFlare calculates both automatically from synced cost and revenue data, and you can customize your campaign reports to show ROI, ROAS, and other metrics side by side, with color coding to flag profitable versus losing campaigns at a glance.
Why does my ROAS look good but my bank account doesn't?
This usually means your ROI is thin or negative even though ROAS is strong, a sign that product costs, fulfillment, or overhead are eating into the revenue your ads are generating.
Want ROAS and ROI in one dashboard?
Try out ClickFlare for free and book a call with one of our tracking specialists who will guide you through the entire process.
TRY CLICKFLARE FREE FOR 14 DAYS →