

Black Friday came early. Early-access prices until Nov 8.Black Friday: early-access prices until Nov 8.Early-access price ends in0d00h00m00sClaim the deal


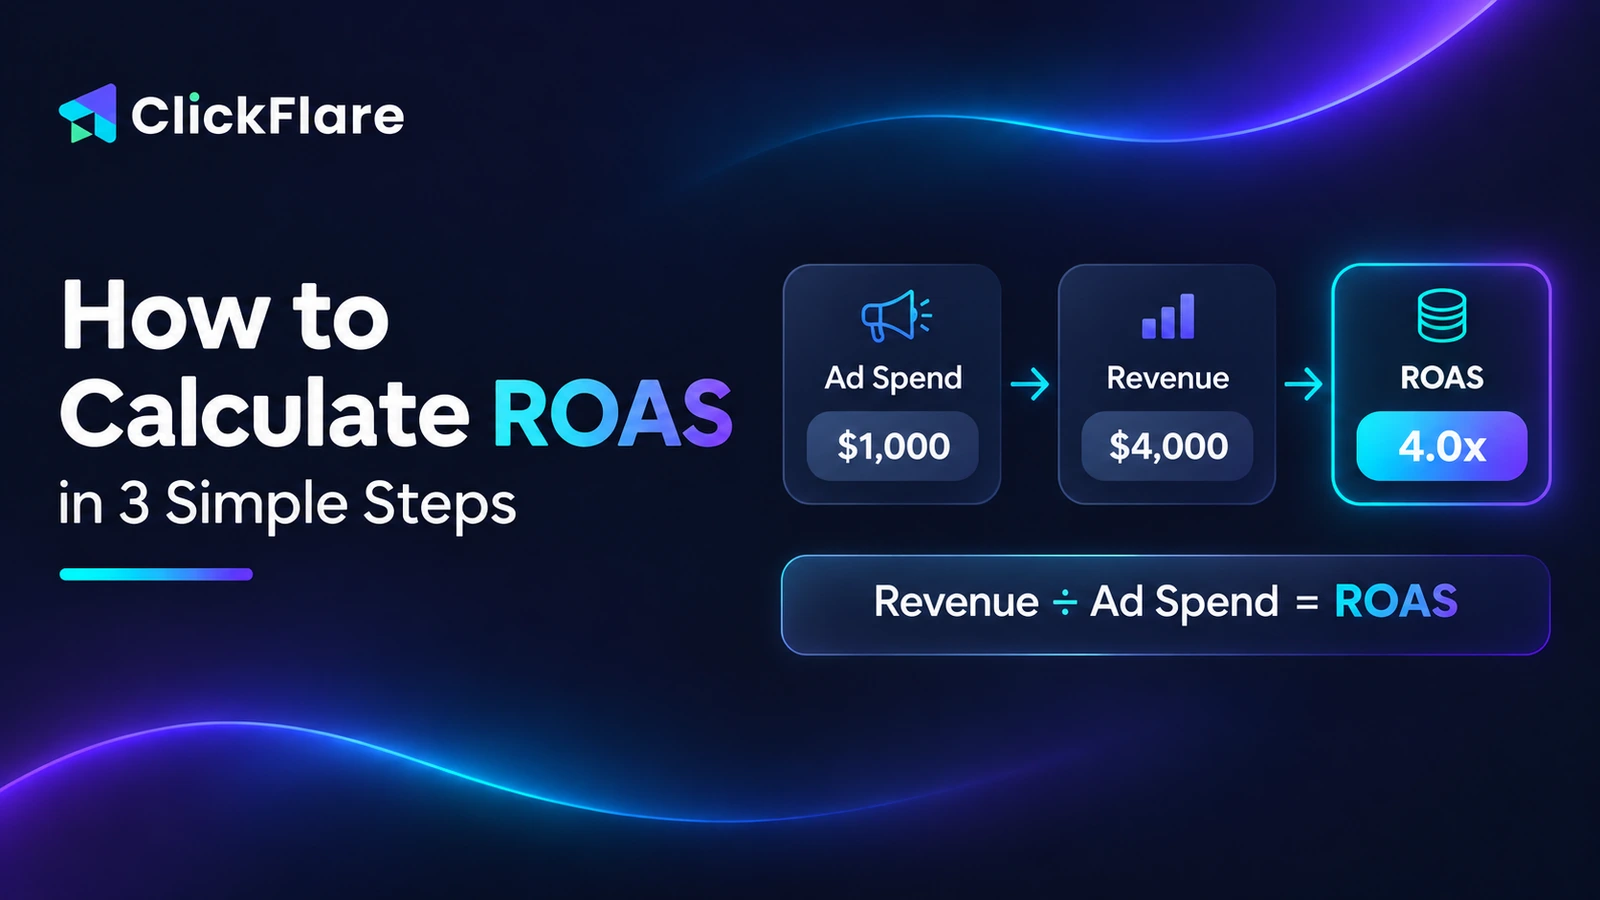

Every advertiser eventually asks the same question: am I actually making money on this ad spend? Learning how to calculate ROAS (return on ad spend) is the fastest way to answer it, because the number tells you exactly how much revenue each advertising dollar brings back. The math itself is simple, but getting a figure you can trust depends on using the right revenue and cost inputs.
In this guide, we will walk through the ROAS formula, how to calculate it step by step with real examples, what counts as a good ROAS, and practical ways to improve it. We will also cover the common mistakes that quietly inflate or deflate the number, so the ROAS you report is one you can actually act on.
Quick Summary
ROAS stands for return on ad spend. It is a marketing metric that measures how much revenue you earn for every dollar you spend on advertising. It is usually written as a ratio (4:1), a plain number (4), or a percentage (400%), and they all mean the same thing.
A ROAS of 4 means you earned $4 in revenue for every $1 spent on ads. The higher the number, the more efficient the campaign. A ROAS below 1 means you are spending more than you are making back, at least on that revenue line.
ROAS is the go-to efficiency metric for paid media because it ties directly to the lever you control most: your ad budget. It works across any paid channel, from Meta and Google Ads to native, affiliate, and TikTok campaigns.
The ROAS formula is one of the simplest in marketing:
ROAS = Revenue From Ads ÷ Ad Spend
That is the whole equation. Two inputs, one division. Where it gets interesting is deciding what belongs in each of those two numbers, which we cover in the inputs section below.
You can express the result three ways, depending on what your team is used to reading:
Here is how to calculate ROAS in three steps, using numbers you can pull from any campaign.
Add up the revenue that came specifically from the campaign you are measuring. This is sales or conversion value attributed to those ads, not your total store revenue for the period.
Add up what you paid the platform for that same campaign, over the same date range. Keep the time windows identical, or the ratio will be off.
Divide the revenue from Step 1 by the spend from Step 2. The result is your ROAS.
Say a campaign generated $8,000 in revenue on $2,000 in ad spend:
$8,000 ÷ $2,000 = 4 (a 4:1 ROAS, or 400%)
Here are a few more worked examples at different spend levels so you can see the pattern:
| Revenue From Ads | Ad Spend | ROAS | Read As |
|---|---|---|---|
| $10,000 | $2,000 | 5 | 5:1 / 500% |
| $6,000 | $2,000 | 3 | 3:1 / 300% |
| $2,500 | $2,500 | 1 | 1:1 / 100% (break-even on revenue) |
| $1,500 | $2,000 | 0.75 | 0.75:1 / 75% (losing money) |
One of the biggest advantages of a tracker is that you can run this calculation at the ad level, not just the account level. Instead of one blended ROAS for all of Meta, you see which individual ad, creative, or placement is pulling a 6:1 and which is dragging you down to 0.8:1.
The formula never changes. The accuracy of your ROAS comes down to what you feed into it. Getting these inputs wrong is the single most common reason reported ROAS does not match reality.
Use the revenue that is genuinely attributable to the ads you are measuring. For an ecommerce store, that is the order value from ad-driven sales. For lead gen or affiliate campaigns, it is the payout or conversion value tied to those clicks.
Decide early whether you are using gross revenue or net revenue (after refunds, chargebacks, and returns). Net is more honest, especially in verticals with high return rates.
At a minimum, ad spend is what the platform charged you. Many teams stop there, and that is fine for a pure media-efficiency read.
If you want a fuller picture, you can also factor in agency fees, creative production, or tool costs. Just be consistent: once you decide what goes into "spend," apply it the same way across every campaign so your comparisons stay fair.
Revenue only lands in your ROAS if it is correctly attributed to the ad that drove it. When cookies get blocked, a conversion fires late, or two platforms both claim the same sale, your revenue input gets distorted and your ROAS lies to you.
This is exactly why server-side tracking and clean cost syncing matter so much. If you have ever seen different conversion counts on Meta, your network, and your tracker, our breakdown of the complete guide to ad spend tracking explains how to keep cost and revenue aligned.
There is no universal "good" ROAS. A 3:1 can be excellent for a high-margin digital product and a disaster for a low-margin ecommerce store. The honest answer is that a good ROAS is any ROAS above your break-even point.
Your break-even ROAS is the point where ad-driven revenue exactly covers the cost of goods plus the ad spend. The formula is simple:
Break-Even ROAS = 1 ÷ Profit Margin
If your profit margin is 40%, your break-even ROAS is 1 ÷ 0.40 = 2.5. Anything above 2.5:1 is profit; anything below is a loss. Here is a quick reference by margin:
| Profit Margin | Break-Even ROAS | What You Need to Clear It |
|---|---|---|
| 20% | 5.0 | $5 revenue per $1 spent |
| 30% | 3.3 | $3.30 revenue per $1 spent |
| 40% | 2.5 | $2.50 revenue per $1 spent |
| 50% | 2.0 | $2 revenue per $1 spent |
| 70% | 1.4 | $1.40 revenue per $1 spent |
As a rough industry reference, many ecommerce advertisers treat a 4:1 ROAS as a healthy target, but your own margin math always beats a generic benchmark. A high-margin SaaS or info product can thrive at 2:1, while a thin-margin retailer might need 6:1 just to stay profitable.
ROAS and ROI get mixed up constantly, but they answer different questions. ROAS measures revenue against ad spend only. ROI measures profit against your total costs, including cost of goods, fees, and overhead.
That is why a campaign can show a strong ROAS and still lose money once every cost is counted. ROAS is your fast efficiency gauge; ROI is your true profitability check. We cover the full difference, with examples, in our dedicated guide on ROAS vs ROI.
Once you can calculate ROAS accurately, the next job is raising it. Improving ROAS comes down to two levers: earning more revenue per dollar spent, or cutting the spend that is not pulling its weight. Here are the most effective ways to increase ROAS.
Break your ROAS down to the ad and placement level, then pause the ones running below break-even. The budget you free up can move to the ads already beating your target. This single step often lifts blended ROAS faster than any creative change.
If conversions are being missed or double-counted, no optimization will help, because you are tuning against bad data. Server-side tracking and a consistent source of truth across platforms recover revenue that client-side tracking loses, which raises measured ROAS without touching the campaign at all.
Sending accurate conversion events back to Meta, Google, and TikTok through a Conversion API helps their algorithms optimize toward buyers, not just clickers. Better targeting means more revenue per dollar. Google's own Target ROAS bidding relies on exactly this kind of accurate conversion-value signal.
Upsells, bundles, and free-shipping thresholds increase revenue per conversion without increasing ad spend, which pushes ROAS up directly. A buyer who spends $75 instead of $50 improves your ROAS by 50% on the same click cost.
More conversions from the same traffic means more revenue on the same spend. Faster pages, clearer offers, and tighter message match between ad and landing page all move the needle.
Focus budget on the audiences, geos, and dayparts that historically convert, and reduce exposure to the ones that drain spend. Small shifts here compound quickly across a large account.
Doing this by hand in a spreadsheet works for one campaign. It falls apart the moment you are running dozens of ads across multiple platforms and networks, each with its own numbers.
ClickFlare removes the manual step. It syncs cost data from your ad platforms and revenue data from your networks and integrations into one dashboard, then calculates ROAS and ROI automatically. Because the cost and revenue update in near real time, your ROAS stays current instead of being a stale number you rebuild every Monday.
A few things that make accurate ROAS easier in ClickFlare:
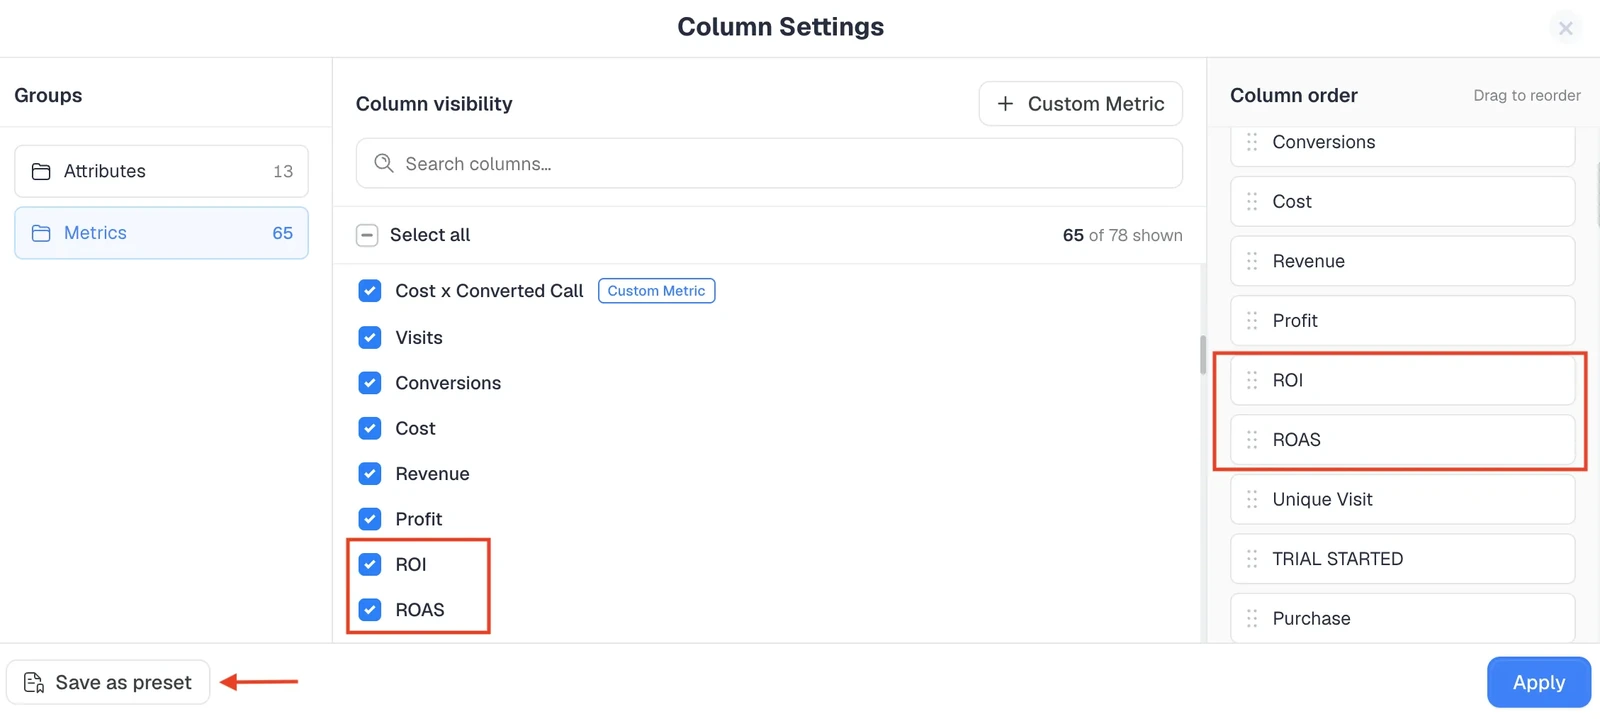
ROAS as a report column. Turn on ROAS (and ROI) in Column Settings and see it side by side with revenue, cost, and profit.
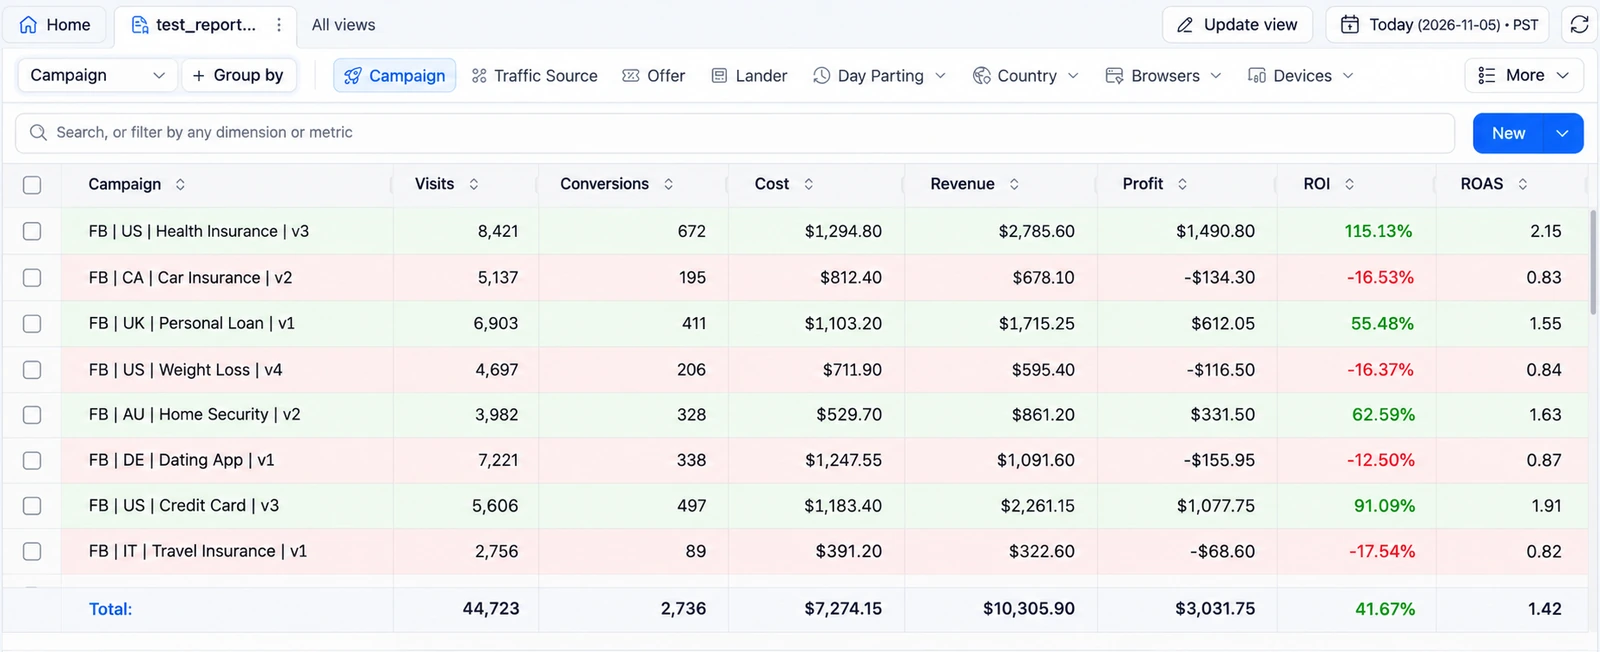
Any breakdown you need. View ROAS by campaign, ad, traffic source, or any filtered dimension, so you can spot the exact ad dragging the account down.
Conditional formatting. Profitable campaigns highlight in green and losing ones in red, so winners and losers jump out at a glance.
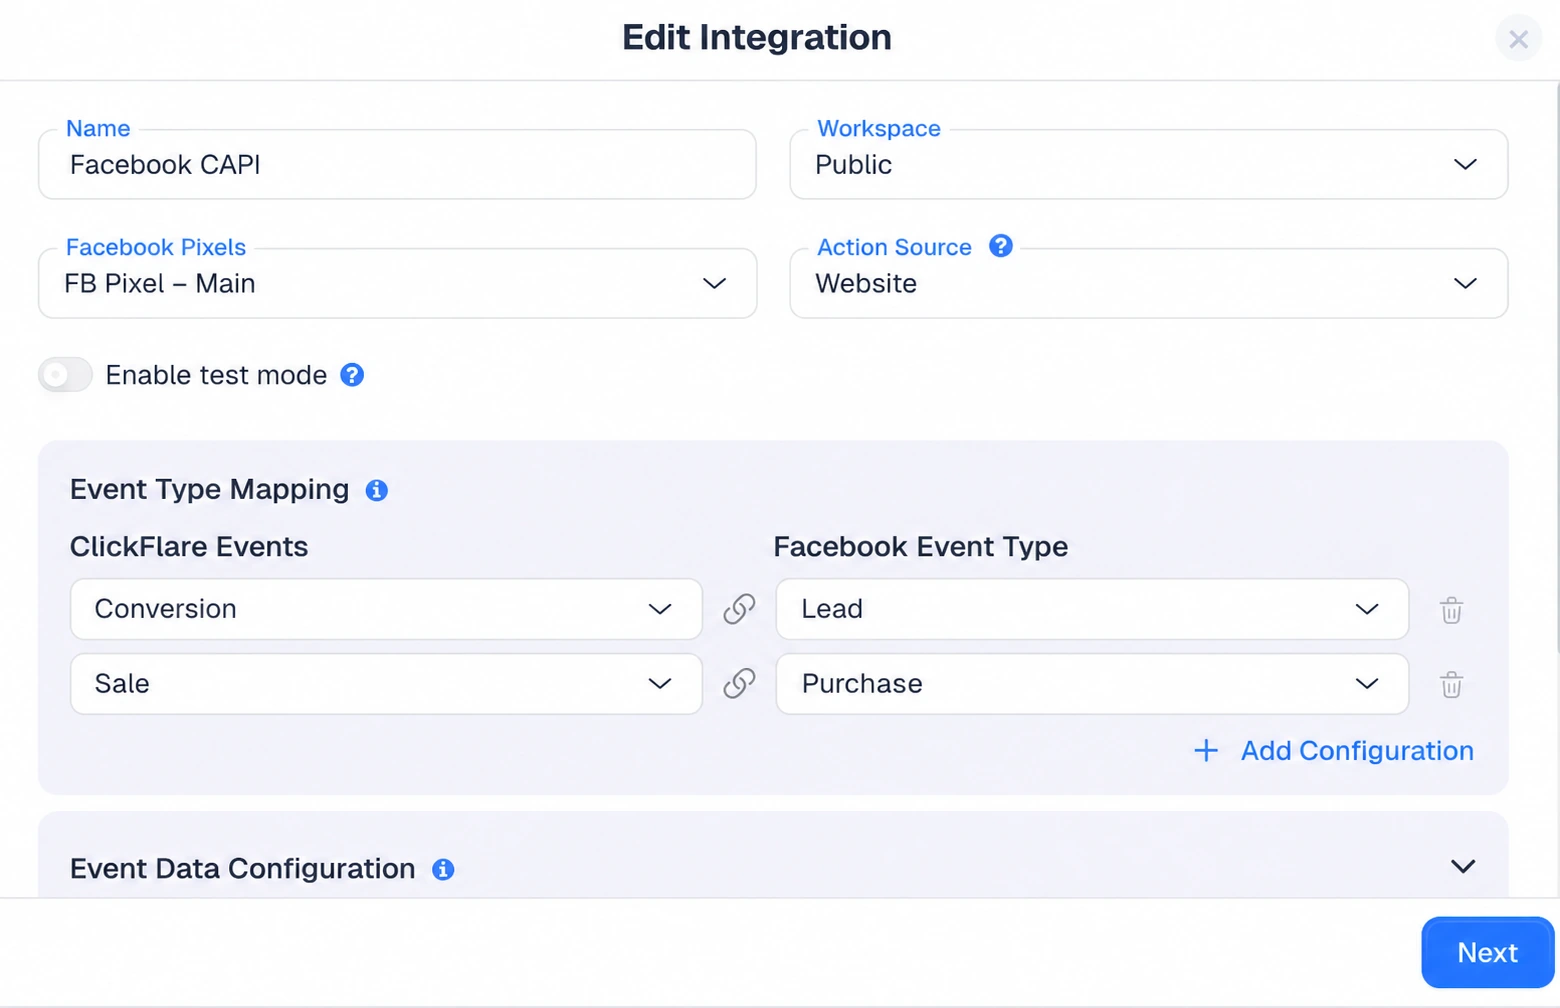
Server-side accuracy. With S2S postbacks and Conversion API support, the revenue feeding your ROAS holds up even as cookies and browser restrictions tighten.
If you are choosing a tool to handle this, our roundup of the best ad tracking software in 2026 compares the main options on pricing, integrations, and who each one fits best.
Learning how to calculate ROAS takes about ten seconds once you have the two inputs: revenue from ads divided by ad spend. The real skill is making sure those inputs are clean, comparing the result against your break-even ROAS instead of a generic benchmark, and drilling down to the ad level so you know precisely where your returns are coming from.
Get the measurement right and the optimization follows. Cut the waste, fix your attribution, raise your order value, and feed accurate data back to the platforms, and your ROAS climbs on the same budget. A dedicated tracker just makes it effortless to see that number the moment it changes.
The ROAS formula is revenue from ads divided by ad spend. If a campaign earns $8,000 in revenue from $2,000 in ad spend, your ROAS is 4, written as 4:1 or 400%. It measures how much revenue each advertising dollar returns.
A good ROAS is any figure above your break-even point, which equals 1 divided by your profit margin. Many ecommerce advertisers target around 4:1, but a high-margin business can profit at 2:1 while a low-margin one may need 6:1.
No. ROAS compares revenue to ad spend only, while ROI compares profit to all your costs, including cost of goods and fees. A campaign can show a strong ROAS and still lose money once every expense is counted in ROI.
Calculate ROAS normally (revenue divided by ad spend), then multiply by 100. A ROAS of 4 becomes 400%. A ROAS of 2.5 becomes 250%. The percentage and the ratio describe the same return, just in different formats.
Each ad platform counts conversions with its own attribution rules and tends to over-credit itself, so the same sale can be claimed twice. A neutral tracker that syncs cost and revenue in one place gives you a single, consistent ROAS to trust.
Need a hand calculating ROAS?
Try ClickFlare free and let it sync your cost and revenue so ROAS is calculated for you, per campaign, ad, and source.


